|
|
|
|
|
|
|
|
|
|
|
|
_
|
|
The Monthly Consumer Survey from BIGinsight™ monitors over 8,000 consumers each month providing unique insights & identifying opportunities in a fragmented and transitory marketplace.
Talking Points:
- Consumer Confidence climbs for a second consecutive month, though remains well below pre-recession Aug-07
- July’s relatively bullish outlook for hiring fades in August
- Focus on needs when spending becomes a little less sharp in August
- End-of-August pump price prediction: $3.76/gal
- Are shoppers turning to EDLP when it comes to buying clothing?
- Foot Locker gets its kicks again in Shoes this month
- If retailing was like the Olympics, Dick’s would take home gold in Sporting Goods
- Consumer Buzz: Groceries (including Whole Foods, Trader Joe’s)
- 90 Day Outlook: Back-to-Shopping?
- Hot in August: Michael Phelps or teammate Ryan Lochte?
|
|
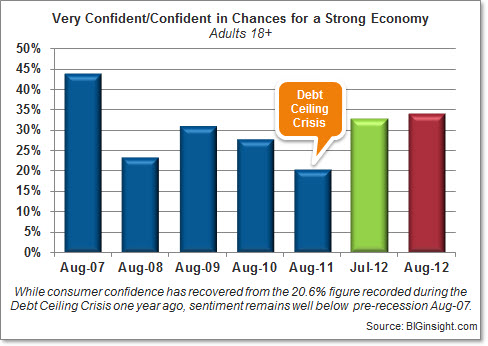
Economic sentiment climbs for a second consecutive month…34.0% are confident/very confident in chances for a strong economy in August, up a point from July (32.8%) and increasing 65% from Aug-11 (20.6%) – WHAT?! Recall that the debt ceiling crisis reached a fever pitch this time a year ago; as a result, confidence in the economy plummeted to its lowest point in more than two years. While this month’s reading is a step in the right direction, it remains well below pre-recession Aug-07 (43.9%).
For more on consumers’ thoughts on the economy and chances for a rebound, see: The New Normal, According to Consumers
With the official U.S. unemployment rate failing to improve for yet another month, July’s relatively bullish outlook for hiring fades in August…currently, more than one in four (27.6%) is predicting “more” layoffs over the next six months, up from 25.9% 30 days ago and reaching a new high for 2012. The majority (55.5%) anticipates layoff levels to remain the “same,” while fewer than one in five (16.9%) is optimistic for “fewer.”
Trepidation about becoming laid off continues to be evident in August…this month, 4.0% personally worry about being handed a pink slip, off slightly from July (4.2%), but up nearly half a point from a year ago (3.6%).
Although we’re nearly in the throes of the 2012 Presidential election, it appears that consumers remain, well, quelled as summer draws to a close…this month, fewer than one in five (19.0%) say they’re worrying more about political/national security issues, down almost a point from last month (19.7%) and five points from debt crisis addled Aug-11 (23.9%). And, consumers continued to maintain a calmer state of mind compared to the same period during the 2008 McCain/Obama race (Aug-08, 24.4%).
|
|
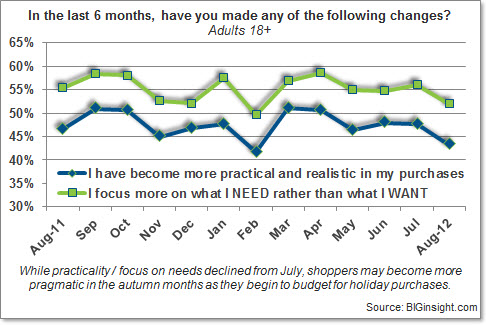
The slight boost in confidence this month has the opposite effect on practical purchasing tendencies…while more than two in five (43.5%) report pragmatic shopping habits when at the store, this figure has lowered from July (47.8%) as well as one year ago (46.8%). Will this trend continue? Don’t bet on it…as we approach the autumn months, shoppers may begin to pull back as they start bracing themselves for holiday spending.
In similar fashion, focus on needs over wants when spending becomes a little less sharp in August…although more than half (52.0%) are still sticking to just the necessities, this figure has lowered from last month (56.1%) as well as Aug-11 (55.5%).
Although financial plans look a little less aggressive than what we saw last month, saving and not spending still seem to be on shoppers’ radar in August…this month, about a third (32.2%) intends to decrease overall spending over the next three months, down from July (36.1%), but up slightly from Aug-11 (31.8%) and Aug-10 (31.2%). More than one in four (26.6%) plan to fatten up their piggy banks, off nearly two points from 30 days ago (28.3%), but remaining consistent with – or even up slightly from – August readings for the past three years. Nearly one in three (31.6%) also plans to drive down debt this month, while one in five (19.2%) is attempting to pay with cash more often.
For complimentary access to additional insights regarding consumers’ financial plans and other issues affecting spending, click over to our Vital Signs InsightCenter™.
With national average gas prices creeping back up into the upper $3/gal range over the past month, you can expect smart shopping strategies to continue among the nearly three-quarters who say they’ve been impacted by the pain at the pump. Heading toward the sale racks (41.4%), shopping closer to home (41.2%), and taking fewer shopping trips (40.2%) are among the most popular plans to defray pumped up prices, while clipping coupons (37.0%) and opting for generics (33.8%) follow.
It may seem a little late in the season for a drought, but if this trend continues, we may see spending dry up into autumn…the majority (56.3%) agrees that prices at the pump will likely continue to accelerate through Labor Day weekend, up from the 30.0% who felt the same way headed toward the end of July. More than a third (36.9%) predicts that the price per gallon will remain about the same, while just 6.8% is optimistic for a decline. Drivers are anticipating an average pump price of $3.76/gal by August 30, $0.30 higher than their forecast for the close of July ($3.46/gal).
|
|
Are shoppers turning to EDLP when it comes to buying clothing? This month, 16.0% indicated that “sales aren’t important to me” when purchasing apparel, increasing from Aug-11 (13.5%) and Aug-10 (12.4%). However with the vast majority either “usually” (64.0%) or “only” (20.0%) buying clothing on sale, retailers ought to be prepared for bargain-hunting Back-to-School shoppers this month.
Walmart wins in Women’s Clothing in August with 12.9% shopping the discounter most often, over rival Kohl’s (11.4%). Macy’s (7.1%) continues a slim lead over JC Penney (6.8%), while Target (3.9%) rounds out the Top 5.
The Bentonville behemoth maintains a more comfortable lead over in the Men’s section…with 17.2% shopping there most often, Walmart is trending ahead of Kohl’s (11.7%), JC Penney (8.8%), Macy’s (6.0%), and Target (3.9%).
With more than double the lead of its nearest competitor, Walmart proves it’s ahead of the curve in Children’s Clothing…the complete Top 5 for August: 1. Walmart (15.6%), 2. Kohl’s (6.2%), 3. Target (6.1%), 4. JC Penney (3.8%), and 5. Macy’s (2.3%).
Foot Locker (3.5%) gets its kicks again in Shoes this month, with the specialty store once again bumping JC Penney (3.4%) out of the Top 5 for this category. Of course, Walmart (11.4%) and Payless (11.2%) continue to sprint ahead of the rest of the pack: Kohl’s (6.1%), DSW (3.8%), and Foot Locker (3.5%).
Despite recent news of showrooming, store closings, layoffs, and rumblings of going from public to private, consumers still choose Best Buy (35.9%) as the store they shop most often for Electronics (keep in mind that “shop” and “buy” are two different terms, though)…Walmart finishes a respectable second (21.4%), while Amazon.com (6.1%), Target (3.7%), and Sears (1.5%) complete the Top 5.
If retailing was like the Olympics, Dick’s would take home gold in Sporting Goods…the big box tops the scoreboard this month with 15.3% shopping there most often, while close rival Walmart wins silver (14.6%) and Sports Authority settles for bronze (4.9%). Big 5 (3.9%) and Academy (3.4%) place just out of medal contention.
With the majority of consumers headed to either Home Depot (31.7%) or Lowe’s (27.6%) for their Home Improvement/Hardware needs, these two big boxes continue to school the rest of the competition: Walmart (6.5%), Menards (3.9%), and ACE Hardware (3.0%).
With its national presence, Walmart is grade “A” with Grocery shoppers…more than one in five (22.0%) fill their pantries at the big discounter, triple the number who shop nearest competitor Kroger (7.2%). Publix (4.3%), Shoprite (3.1%), and Safeway (2.7%) complete the Top 5.
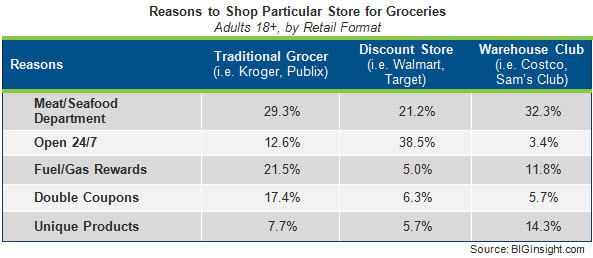
When it comes to the reasons why shoppers choose a particular store most often for Groceries, it’s the usual suspects: price (76.3%), location (71.9%), selection (56.1%), and quality (47.1%). But divide the rationale by the type of store shopped, and you’ll see additional interesting reasons to shop…the meat/seafood department is particularly valued by Warehouse Club shoppers, as is unique product selection. Discount store shoppers respond to 24 hour operation and one-stop shopping convenience, while fuel/gas rewards and double coupons appeal to those headed to a traditional grocery store most often:
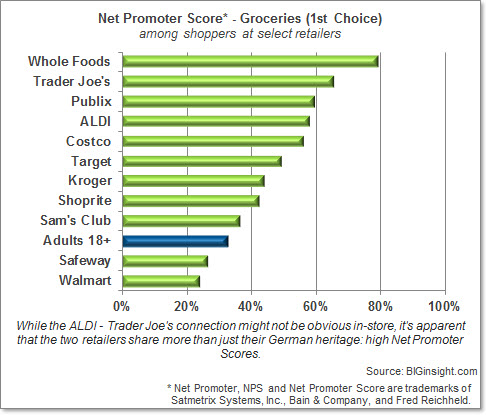
While Walmart is most certainly one of the busiest retailers in the Grocery category, is the discounter the buzziest? We applied the Net Promoter Score* metrics system to our latest grocery insights to show how consumers perceive their store of choice and evaluate the strength of a retailer’s image in this category. Among the 11 stores we evaluated - the Top 5 in this segment as well as some of their specialty, club, and discounter competitors – all retailers maintained positive Net Promoter Scores, revealing that promoters outweighed detractors in all instances. Just two retailers, Walmart and Safeway, rated below the overall average, while specialty markets Whole Foods and Trader Joe’s claim stellar Net Promoter Scores. Publix – recognized by customers for its perimeter shopping selection – as well as ALDI, Costco, and Target also have consumers buzzing pretty loudly:
*Net Promoter, NPS and Net Promoter Score are trademarks of Satmetrix Systems, Inc., Bain & Company, and Fred Reichheld
With nearly a third (30.6%) of consumers headed there most often, Walmart proves its popularity in Health & Beauty Care…traditional druggists CVS (11.6%) and Walgreens (9.1%) follow, while Target (7.4%) and Rite Aid (4.0%) round out the Top 5.
Over in Prescription Drugs, though, CVS (18.2%) and Walgreens (17.0%) move to the head of the class…Walmart (12.2%), Rite Aid (6.6%), and Target (3.1%) follow.
|
|
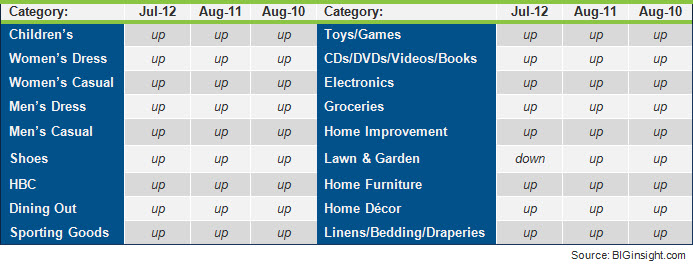
Is this Back-to-Shopping season? With school nearly in session, popular categories like Children’s Clothing, Shoes, Health & Beauty Aids, and Electronics are looking UPward over the next 90 days, according to the BIGinsight™ Diffusion Index. In addition, all other categories – save for seasonal Lawn & Garden – are poised for spending increases compared to last month, last year, and Aug-10:
Retail Merchandise Categories - 90 Day Outlook
(Aug-12 compared to Jul-12, Aug-11, and Aug-10)
Here’s the million dollar question, though: Is the 90 Day Outlook rising because consumers are buying more merchandise or because prices are rising overall? For more on this topic, click for complimentary access to the Economic Indicators InsightCenter™, which provides a clear picture of the U.S. economy from all angles. Utilizing consumer sentiment data on future spending and government retail sales figures, the Economic Indicators InsightCenter™ also provides predictions on the direction of retail sales over the next 90 days to help retailers anticipate fluctuations in an ever-changing marketplace.
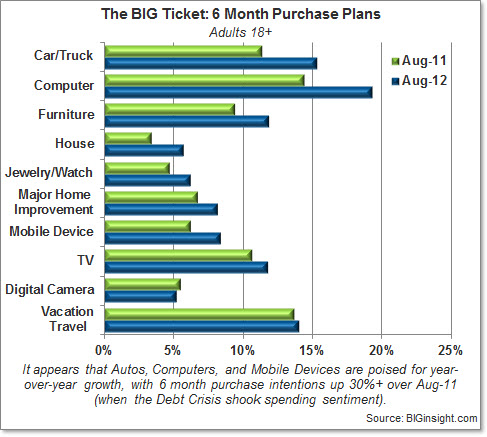
While last summer’s debt crisis shook consumers’ spending confidence, it appears that shoppers are maintaining a more optimistic stance this year when it comes to big ticket purchasing over the next six months (which, of course, includes the upcoming holiday season)…compared to Aug-11, purchase intentions are on the rise for computers, autos, housing, furniture, jewelry, mobile devices, major home improvements, and TVs, while digital cameras and vacation travel are relatively flat:
|
|
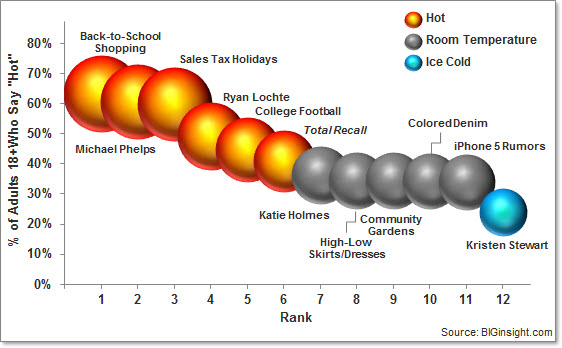
While Michael Phelps is certainly golden in the pool, he’s a bit like a fish out of water compared to back-to-school shopping…that’s right, parents eager to send their children back to class bested the most decorated Olympian in history for What’s Hot this month…sales tax holidays, and Phelps’ teammate Ryan Lochte also rate highly in August, while college football scores with men [well, duh]. Women under 35 are eyeing colored denim for the fall as well as the rumored iPhone 5 release, while their 35+ counterparts are spending time in community gardens. What’s not? Scandal-plagued Kristen Stewart…it seems that this Twilight star has lost her bite among movie-goers.
Editor
BIGinsight™ is a trademark of Prosper Business Development.
400 West Wilson Bridge, Suite 200, Worthington, Ohio 43085
614-846-0146 • FAX 614-846-0156 • info@BIGinsight.com
follow us...
![]()
We welcome and appreciate the forwarding of our Executive Briefings in their entirety or in part with proper attribution.
© 2012, Prosper®


