|
|
|
|
|
|
|
|
|
|
|
|
_
|
|
The Monthly Consumer Survey from BIGinsight™ monitors over 8,000 consumers each month providing unique insights & identifying opportunities in a fragmented and transitory marketplace.
Talking Points:
- As the summer weather heats up, Consumer Confidence cools off
- Good luck, Class of 2012: Employment Outlook dims
- May’s dip in practicality appears to have been just a “blip” on consumers’ spending radar
- Pain at the Pump: No gas price “fireworks” expected to set off for the holiday
- Walmart wins in Women’s Clothing
- Consumer Migration: Men’s Clothing
- 90 Day Outlook is looking UPward
- What’s Hot? Saving is in style in June…
|
|
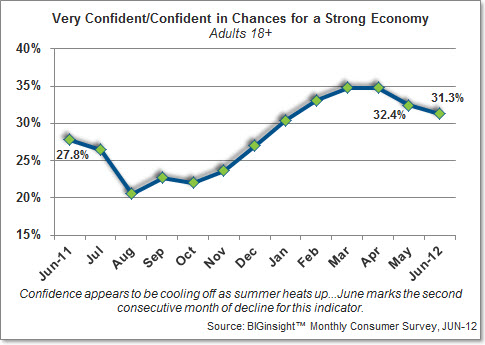
As the summer weather heats up, confidence in the economy cools off…this month, just 31.3% feels very confident/confident in chances for a strong economy, down from 32.4% last month and marking the second consecutive month of decline for this indicator. Consumers are still relatively more optimistic than they were a year ago (27.8%) as well as two years ago (30.2%), but sentiment indexes well below pre-recession Jun-07 (43.9%).
Consumers’ flatlining confidence in the economy might be due to their weak outlook for employment (or vice versa)…with the official U.S. unemployment remaining a discouraging 8.2%, an increasing number of consumers (27.0%) foresee a rise in layoffs over the next six months compared to May (23.3%). The majority (56.3%) are predicting that layoff levels will remain the same (versus 55.5% last month – but we know that “more of the same” isn’t all that great, right?) Fewer than one in five (16.6%) is anticipating a decline in layoffs, shrinking from May (21.3%). [Good luck, Class of 2012]
Does lack of improvement in the labor market have more workers worried about their ability to maintain steady employment? In June, 3.7% indicated that they were concerned with becoming laid off, rising half a point from last month (3.2%). Still, this figure remains well below the June high we saw back in 2009 (7.6%).
With the “fun” barely just begun with Election 2012, consumers are feeling slightly more anxious about political and national security issues…this month, about one in five (19.5%) say they are worrying more about these matters, rising nearly a point from May (18.8%) and increasing from Jun-11 as well (18.9%). Still, we seem to be in a more stable mindset than compared to start of the McCain vs. Obama campaigns: nearly one in four (23.3%) expressed concerns back in Jun-08.
Interested in more of our legislative-minded data? Check out our latest American Pulse blog: Talking to Text – Harmless or Hindering for Drivers?
|
|
Last month’s dip in practicality looks like it may have just been a “blip” on consumers’ spending radar…this month nearly half (48.2%) say they’ve become more pragmatic in their purchasing, up nearly two points from May (46.6%) and in line with Jun-11 (48.5%). Additionally, practicality remains elevated from the June readings we recorded during the recession, suggesting that fault lines in the macro-economy (like employment, healthcare, national debt, overall economic stability, gas prices, overseas issues – need I go on?) are still rattling spending plans on a micro level.
While focus on necessities didn’t increase in kind this month, the majority continues to zero in on just what they need when at the store. This month’s figure (54.7%) remains relatively on par with May (55.0%) as well as Jun-11 (55.2%) and is relatively consistent with the June readings we recorded throughout the recession.
With practicality popping up in June, consumers are maintaining their fiscal focus...this month about one-third (32.8%) is intent on decreasing overall spending, and just as many (32.6%) aim to pay down debt. While these figures have each backed down about a point from May, they remain elevated from Jun-11. More than a quarter (26.8%) also have plans to pad their piggy banks and one-fifth (20.1%) is paying with cash more often.
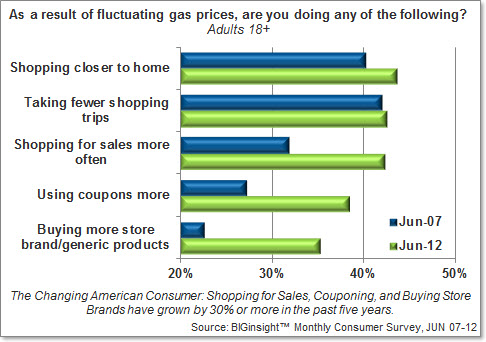
While the summer gas price hike is looking relatively deflated [fingers crossed], drivers are still pumped up about smart shopping strategies that help defray the expense of fueling up…shopping closer to home (43.6%), taking fewer shopping trips (42.4%), shopping for sales more often (42.2%), couponing (38.3%), and buying store brands/generics (35.2%) continue to drive the penny-pinching bandwagon. Now, do you have your doubts about The Changing American Consumer? Here’s a peek at how relatively unfocused drivers were on saving back in Jun-07:
Perhaps because Independence Day is landing on a Wednesday – and not the weekend – this year, consumers aren’t bracing for the gas price fireworks to set off over the holiday…fewer than two in five (38.1%) believe that the cost of fueling up will pump up by the end of the month, lowering from the near majority (49.2%) who felt the same about the direction heading toward the end of May. More (43.2%) think gas prices will remain the same, while nearly one in five (18.7%) foresees a decline. Drivers are anticipating an average pump price of $3.75/gal by the end of June, 20 cents lower than their prediction for the close of May ($3.95/gal).
For more on this high-octane topic, head over to the BIG Consumer Blog to read our special series: Pain at the Pump.
|
|
As consumers grow increasingly dependent on their mobile devices, it should come as no surprise that the vast majority (85.8%) regularly or occasionally researches products online before purchasing them in a store. The hottest search topics seem to veer toward the technological and the “good” stuff [#iloveshoes]: electronics (44.0%), apparel (27.0%), appliances (22.8%), and footwear (22.2%). Amazon.com (25.8%) and Google.com (25.0%) are the top sites searched first.
When online browsing escalates into a full virtual shopping cart, where might consumers most often be clicking the “buy” button? For apparel, it’s Amazon.com (12.7%), Walmart.com (7.0%), Kohls.com (5.1%), JCPenney.com (4.6%), and eBay.com (4.0%). Amazon.com (32.8%) also leads when it comes to shopping online for non-apparel items like electronics and home décor…Walmart.com (10.3%), eBay.com (6.2%), BestBuy.com (6.0%), and Target.com (2.6%) follow.
While Walmart plays second fiddle to Amazon in the cyber arena, the big discounter is the big winner this month in Women’s Clothing…Walmart (12.5%) leads close rival Kohl’s (11.7%) in June, while Macy’s (8.2%), JC Penney (6.9%), and Target (3.2%) complete the Top 5.
Did you notice that JC Penney has slipped from #3 in this category? The department store is a hot topic over on the BIG Consumer Blog…click here to read consumers’ latest thoughts on their new strategy: Fair & Square Revisited.
Over in the Men’s section, Walmart’s lead is more secure…nearly one in five (17.5%) shops the Bentonville behemoth most often, while Kohl’s (11.8%), JC Penney (9.1%), Macy’s (6.7%), and Target (3.4%) follow. Price (70.9%) tops the list of reasons to shop a particular store most often for Men’s…selection (53.3%), quality (46.1%), location (39.5%), and retailer trustworthiness (18.0%) are other motivating factors.
While Walmart’s travails are well-documented in Women’s Clothing, does the big discounter’s outlook look any brighter over in Men’s? And, what’s the deal with JC Penney? This month’s Consumer Migration Index (CMI), which tracks those who have immigrated to a store (new customers within the past year, “In”) against those who have emigrated (left within the past year, “Out”) and where a positive rating spells net growth to a retailer, shows that Walmart is standing relatively strong with a +1.7 CMI rating, while the department store is looking squarely at a customer deficit (-3.0 CMI). (Note: Kohl’s, Macy's, and Target did not register enough “emigrating” customers to calculate a CMI, so one can assume a positive CMI rating for these retailers.)
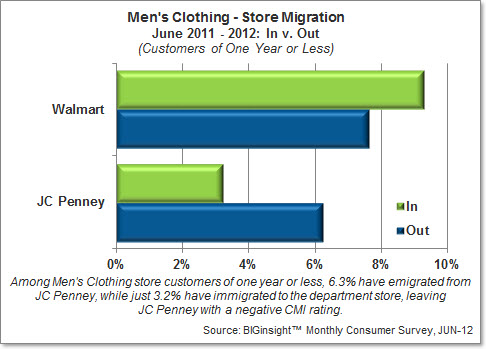
High prices (21.5%) was the top reason cited by shoppers of one year or less to switch stores…inconvenient location (10.1%), unavailability of correct sizes (8.1%), poor selection (8.0%), and lack of newest fashions (7.3%) followed.
Walmart completes the apparel trifecta with the lead in Children’s Clothing this month…14.6% shop the big W most often, substantially ahead of the rest of the pack: Kohl’s (5.8%), Target (5.3%), JC Penney (3.4%), Old Navy (2.1%), and Gap (also 2.1%).
The big discounter is also getting its kicks in Shoes…more than one in ten (12.2%) shops Walmart most often for footwear, followed closely by discount specialty Payless (11.4%). Kohl’s (5.9%), DSW (4.0%), and JC Penney (3.3%) complete the Top 5.
While more people are planning to buy apparel for dear ol’ Dad this year, for those getting Pop what he may really want [read: Electronics], expect Father’s Day shoppers to head to Best Buy, where 32.9% shop most often for TVs, devices, and all other digital gadgetry. Walmart follows with 22.4%, while Amazon.com (8.3%), Target (3.5%), and Sears (1.8%) round out the Top 5.
Tis the season for D-I-Y, right? For everything from paint to power tools and lawn care to lumber, expect three out of five shoppers to head to Home Depot (31.8%) or Lowe’s (28.2%). Walmart (6.7%), Menards (3.5%), and ACE Hardware (3.1%) follow.
Walmart continues to hold court in Sporting Goods…the big discounter leads this category with 15.3% shopping there most often, while Dick’s (14.3%) is just a point back. Sports Authority (4.9%), Academy (3.5%), and Big 5 (3.3%) complete the Top 5.
While traditional grocers (57.3%) lead the foodstuffs segment collectively, Walmart (21.4%) continues to lead this category, specifically speaking. Kroger (7.6%), Publix (4.3%), Safeway (3.0%), and Shoprite (2.7%) follow.
Can the store you shop for Groceries play a role in your health happiness? Click over to the BIG Consumer Blog for our analysis of this topic: Two-Thirds of Trader Joe’s, Whole Foods Shoppers Express Health Happiness.
Walmart also puts on a pretty face in Health & Beauty Care…with about one in three (31.9%) shopping there most often, the big discounter is ahead of CVS (12.4%), Walgreens (10.4%), Target (7.6%), and Rite Aid (4.3%).
It doesn’t seem that Walgreens has found a cure for its shopper ailment in Prescription Drugs…for the fifth consecutive month now, CVS (18.6%) tops this category, while Walgreens (16.4%), Walmart (12.8%), Rite Aid (6.3%), and Target (3.4%) complete the Top 5.
|
|
The 90 Day Outlook is looking UPward compared to the past two years, according to the BIGinsight™ Diffusion Index…however, with spending for the majority of merchandise categories weakening compared to May, look for practical consumers to continue to exercise caution when spending.
Retail Merchandise Categories - 90 Day Outlook
(Jun-12 compared to May-12, Jun-11, and Jun-10)
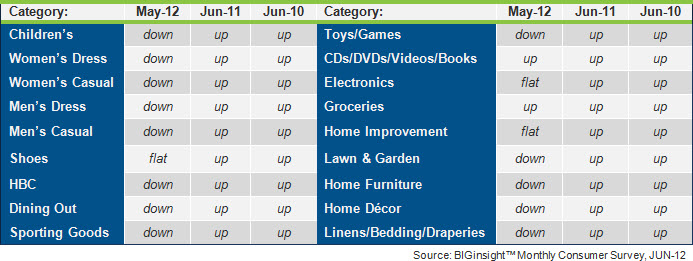
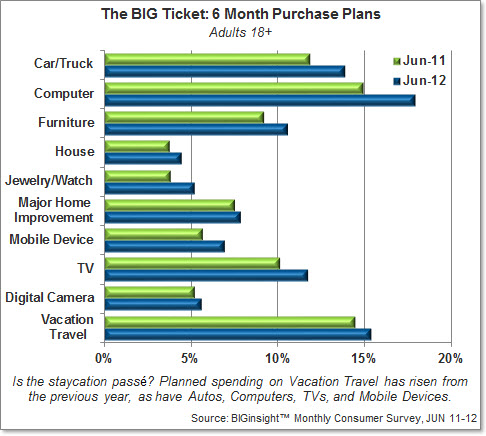
Are lower prices at the pump leaving consumers with a bit of gas in their spending tanks? Six month purchase intentions for all BIG Ticket categories continue to rise from the previous year…notable upward movers in June include Autos, Computers, Mobile Devices, and TVs.
And for additional analysis of the Automotive segment via the Net Promoter® Score, visit the BIG Consumer Blog.
Net Promoter, NPS and Net Promoter Score are trademarks of Satmetrix Systems, Inc., Bain & Company, and Fred Reichheld.
|
|
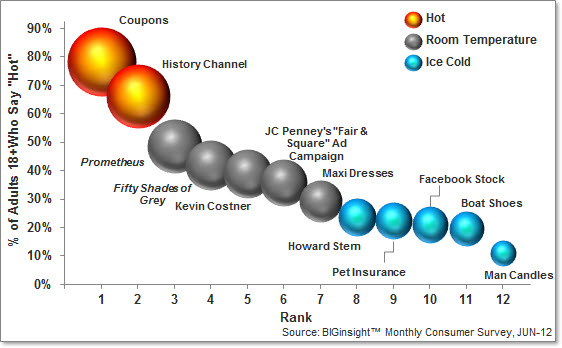
Saving is in style, with Coupons taking the top spot in our list of What’s Hot for June [#attentionJCP]…the History Channel, home of the popular Hatfields & McCoys miniseries, isn’t far behind. Prometheus looks to be a hit among men, while the fairer gender would rather curl up to Fifty Shades of Grey. What’s Not? While nearly 20% of men under 35 are lighting up at the idea of lumber, fresh cut grass, and other masculine aromas filling their homes, most are throwing cold water on the Man Candle trend.
Editor
BIGinsight™ is a trademark of Prosper Business Development.
400 West Wilson Bridge, Suite 200, Worthington, Ohio 43085
614-846-0146 • FAX 614-846-0156 • info@BIGinsight.com
follow us...
![]()
We welcome and appreciate the forwarding of our Executive Briefings in their entirety or in part with proper attribution.
© 2012, Prosper®


![The Father’s Day / Mother’s Day Spending Gap Explained [?]](http://www.biginsight.info/images/dad0612.jpg)


